Welcome to
Wrigleyville
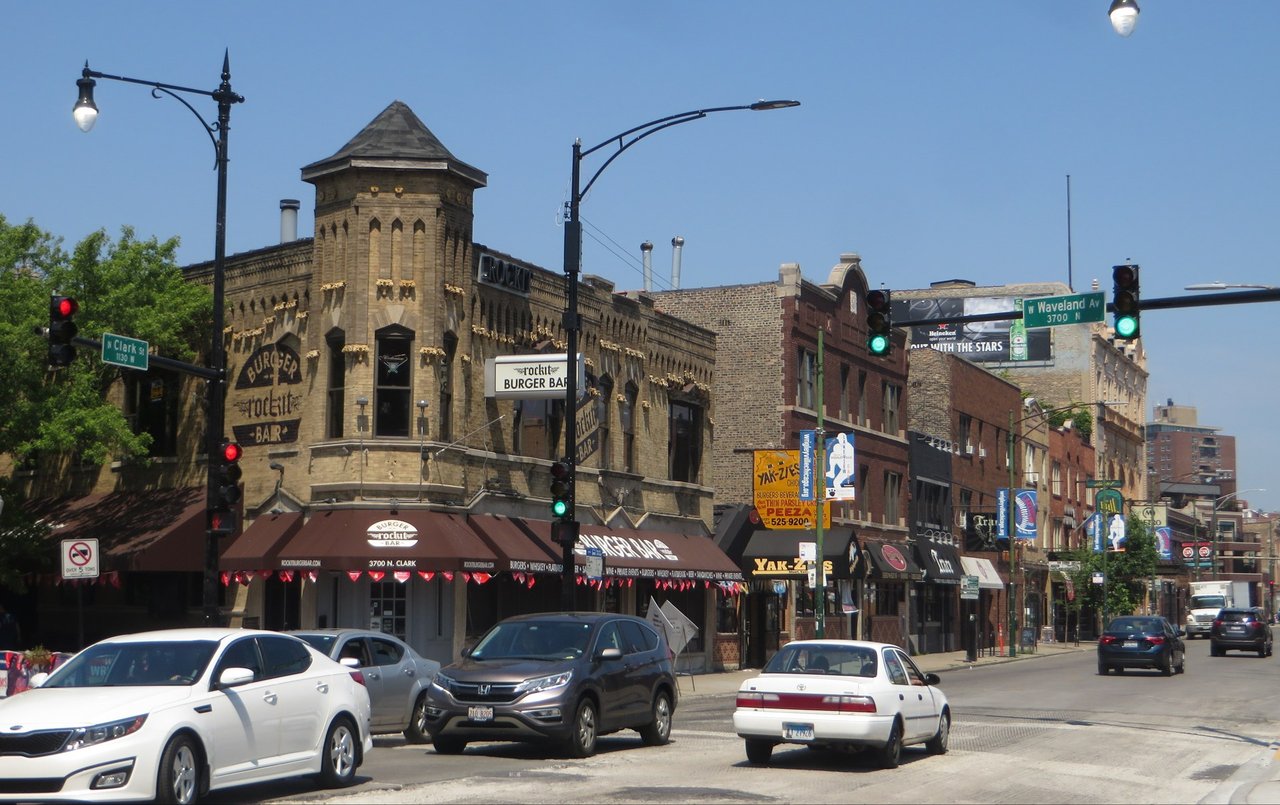
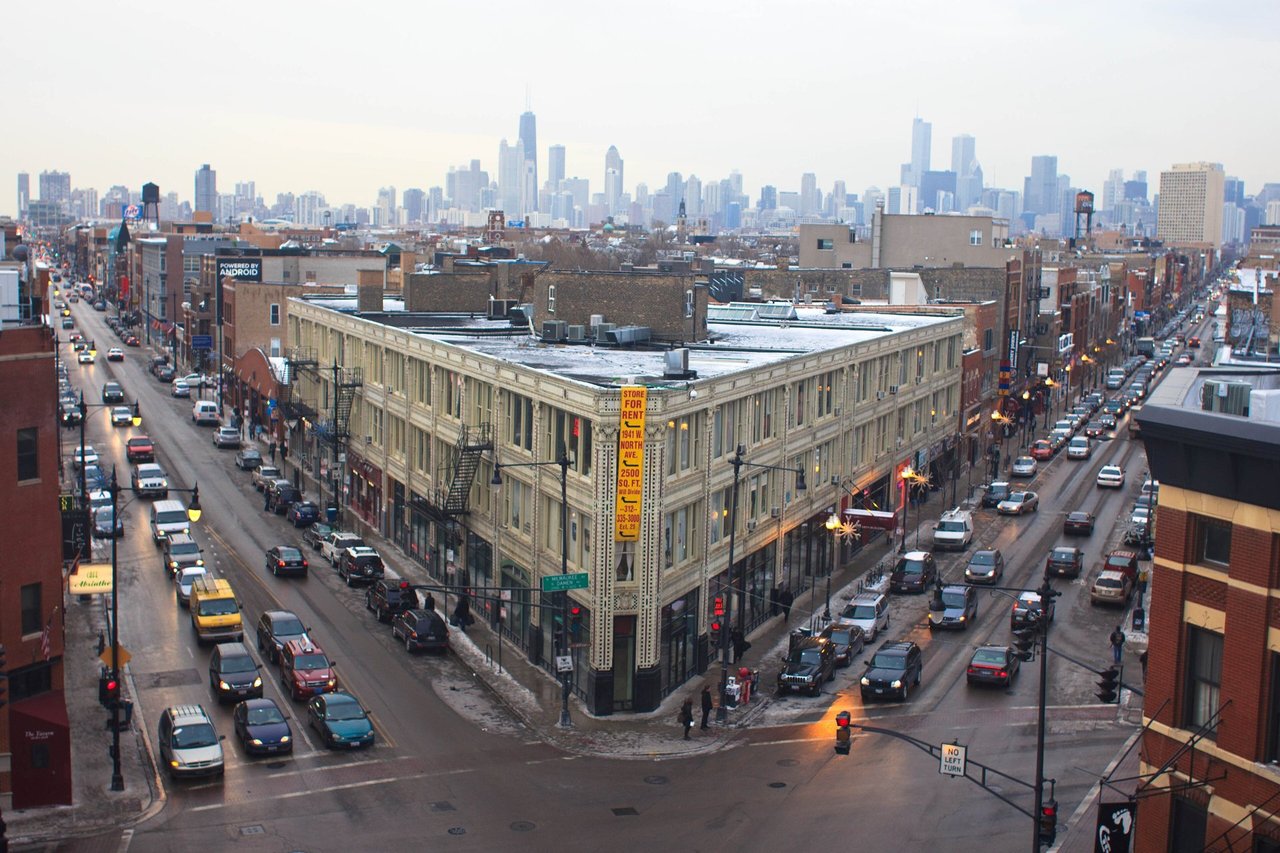
The blocks around Wrigley Field in Lake View: vintage two-flats and condos, lively Clark Street and the Red Line at Addison.
Wrigleyville is the part of Lake View that surrounds Wrigley Field. Clark Street and the Gallagher Way plaza bring the energy on game days, while the side streets are quieter, with tree-lined blocks of vintage buildings a short walk from the lake.
Vintage courtyard buildings, two- and three-flats, condo conversions and newer mid-rise condos, plus single-family homes on the quieter residential blocks.
Chicago Public Schools neighborhood assignment by address, plus magnet and selective-enrollment options. Always confirm the boundary for a specific address.
CTA Red Line (Addison and Sheridan stations), Brown and Purple Lines nearby at Belmont, and Lake Shore Drive a few minutes east.
Sellers: parking and distance from the ballpark change what buyers will pay. We lead with garage or deeded parking and position each home for the right buyer, owner-occupant or investor.
Get a free home value plus a full CMA from a local SpaceMatch agent within 24 hours. What's my Wrigleyville home worth?
Buying? Get new listings in your top areas as soon as they hit the market.
5,630 people live in Wrigleyville, where the median age is 33 and the average individual income is $85,899. Data provided by the U.S. Census Bureau.
Total Population
Median Age
Population Density
Average individual Income
There's plenty to do around Wrigleyville, including shopping, dining, nightlife, parks, and more. Data provided by Walk Score and Yelp.
Explore popular things to do in the area, including Stages Music Hall.
Wrigleyville has 2,794 households, with an average household size of 2. Data provided by the U.S. Census Bureau. Here’s what the people living in Wrigleyville do for work — and how long it takes them to get there. Data provided by the U.S. Census Bureau. 5,630 people call Wrigleyville home. The population density is 26,980 and the largest age group is Data provided by the U.S. Census Bureau.
Total Population
Population Density Population Density This is the number of people per square mile in a neighborhood.
Median Age
Men vs Women
Population by Age Group
0-9 Years
10-17 Years
18-24 Years
25-64 Years
65-74 Years
75+ Years
Education Level
Total Households
Average Household Size
Average individual Income
Households with Children
With Children:
Without Children:
Blue vs White Collar Workers
Blue Collar:
White Collar:















OFFICE 676 N MICHIGAN AVE., #3010 CHICAGO, IL 60611
OFFICE 676 N MICHIGAN AVE., #3010 CHICAGO, IL 60611